The first wave of Covid-19 in India was characterized by the first known case in January 2020 followed by a nationwide lockdown, which was announced in March 2020 and was implemented in phases until end of May 2020. The implementation of a nationwide lockdown on an unprecedented scale affected livelihoods of many including microfinance customers. In the past, the resilience of the microfinance industry was tested by many shock-inducing events like natural calamities, demonetization, political activism etc. The current pandemic is another event which has affected and continues to affect microfinance institutions and their clients.

Exhbit 1: MFI Quarterly Disbursements
In the beginning of the pandemic, disbursements by all financial institutions including banks, NBFC-MFI, etc. shrunk to an all-time low on INR 6,186 crores in Q1 FY 20-21. As seen in exhibit 1, quarterly disbursements slowly picked up and reached pre-covid levels by Q3 FY 20-21. The demand for credit had steadily increased from Q1 FY 20-21 to Q3 FY 20-21 as economic activity picked up with many geographies starting the 'unlock' process during this period. As per our field monitoring visits from Q2 FY 2021, the increase in disbursements was also contributed by demand for smaller loan amounts, in form of additional loans or top-up loans or emergency loans from existing customers.
Such smaller ticket, top-up loans have been disbursed across multiple customer segments and geographies with varying purposes. Many organizations have disbursed these loans to existing customers who are in genuine need of short-term liquidity support and who showed an intent to pay by meeting at least one payment obligation during Q2 FY-21. While these top-up loans are considered as a measure to support the vulnerable segment by customer-centric, impact focussed microfinance institutions, there is a perception of higher risk for these loans, especially when they are disbursed to overdue customers. In this blog, we attempt to describe what a top-up loan is and analyse trends of top-up loans disbursed in terms of customer segment and geography. Please note that we have not presented an analysis of the credit performance of top-up loans in this blog, as it is still too early as it requires at least 6 to 12 months of repayment history after disbursement of these loans to conclusively comment on the same.
Data used for the analysis
Scrub repository is the data available with credit bureaus which can be accessed by lenders, to analyse their borrowers’ credit history in all other obligations. Scrub repository of MFI loans live as on August 2020, which are part of 32 pools securitized by Northern Arc Capital is used for this analysis. The total count of unique customers considered here is 2.66 Lakhs. The important fields which are part of this repository are
Repayment frequencies of different underlying obligations of each customer can vary from bi-weekly to monthly. For EMI based analysis, using scrub data of all underlying customers, payments of all live obligations have been converted into equivalent monthly obligations.
Definition of top-up loan
We use the following criteria for identifying a top-up loan:
The end borrowers satisfying top-up criteria are flagged as borrowers who have availed top-up loan and the latest loan availed by the borrower is tagged as top-up loan.
Data analysis and findings
Summary of Top-up Loans
In the selected sample of 2.66 lakh customers, 21,573 customers, amounting to 8.09%, were identified as customers who have availed top-up loan basis the criteria outlined in the previous segment. Also, out of 1.08 lakh loans disbursed after August 2020 to clients with existing relationship, 25.56% of loans or 27,642 loans can be classified as top-up loans.
Exhibit 2 shows the transition matrix of earlier loans before and after the disbursement of the top-up loan. For instance, 22.34% of overall top-up loans have been sanctioned to close the earlier obligations in 1-29 DPD. It can be clearly inferred that 46.7% of the top-up loans have been used to close the previous loans which are in >0 DPD and 43.67% of top-up loans (total of all the cells highlighted with grey in exhibit 2) have been used to improve the DPD status or help the earlier loan remain in the same DPD status. Only in less than 10% of the cases the DPD status has worsened after disbursement of the top-up loan
|
|
Closed Account |
Current Account |
1-29 DPD |
30-59 DPD |
60-89 DPD |
>89 DPD |
|
1-29 DPD |
22.34% |
9.70% |
6.94% |
2.03% |
0.58% |
0.04% |
|
30-59 DPD |
11.90% |
6.94% |
5.04% |
5.18% |
2.52% |
1.77% |
|
60-89 DPD |
8.81% |
2.65% |
3.82% |
0.79% |
2.23% |
1.90% |
|
>89 DPD |
3.67% |
0.13% |
0.16% |
0.07% |
0.01% |
0.78% |
|
Total |
46.72% |
19.42% |
15.96% |
8.07% |
5.34% |
4.49% |
2: Transition Matrix of account status of the earlier loan before and after disbursement of top-up loan
Indebtedness of borrowers
Exhibit 3 provides distribution of borrowers across different indebtedness buckets and percentage of top-up loans availed in each of the categories. The indebtedness level of a borrower is calculated by taking sum of principal outstanding of all live loans available in microfinance bureau. It can be clearly inferred that the percentage of top-up loans has increased as the indebtedness level of underlying borrower increases. Highest indebtedness bucket of >2L (greater than 2 Lakhs INR) has highest percentage of top-up loans, but they constitute only 0.45% of overall sample of customers.
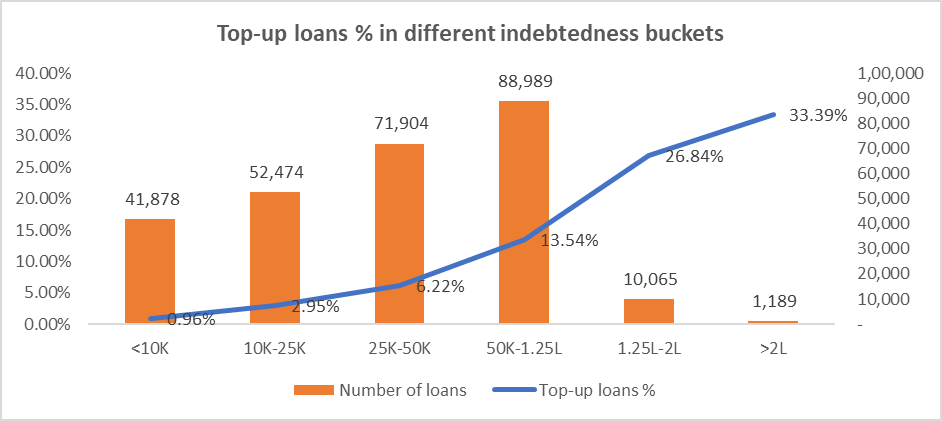
Exhibit 3: Indebtedness bucket wise split of top-up loans
EMI
Exhibit 4 provides distribution of borrowers across different EMI buckets and percentage of top-up loans availed in each of the categories. EMI level of a borrower is calculated by taking sum of monthly outstanding of all live loans available in microfinance bureau. It can be clearly inferred that the percentage of top-up loans has steadily increased as the EMI levels of the customer increases.
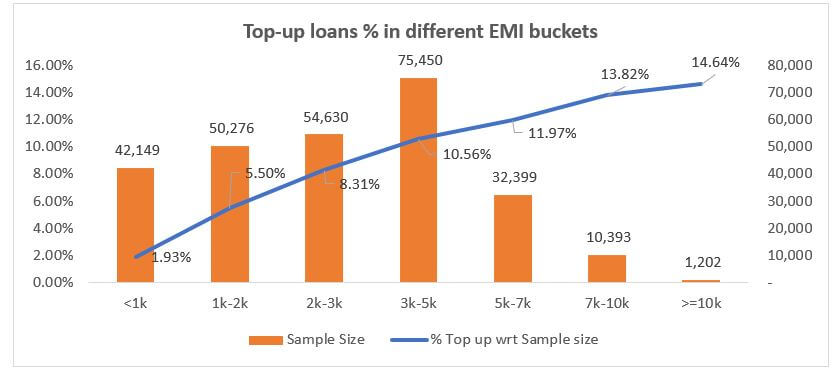
Exhibit 4: EMI bucket wise split of top-up loans
Geographical distribution of top-up loans
Exhibit 5 indicates the number of loans disbursed after August 2020 in 13 Indian states.
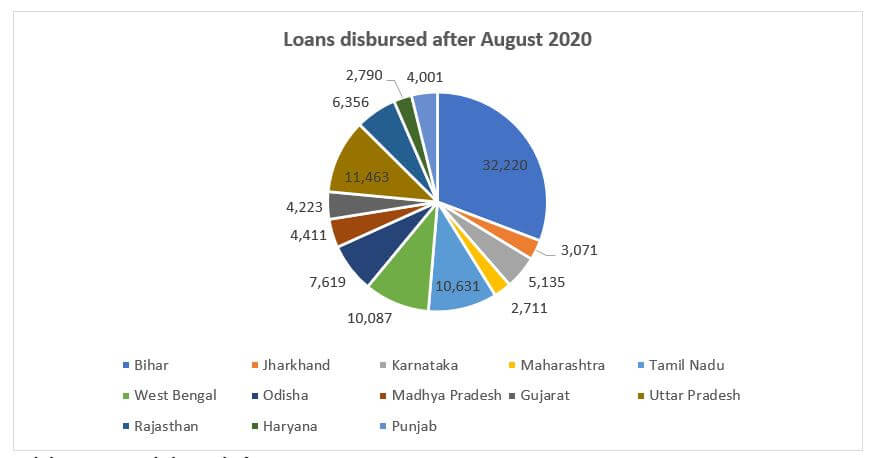
Exhibit 5: Loans disbursed after August 2020
State wise percentage of top-up loans is depicted in exhibit 6. West Bengal, Maharashtra and Odisha are top 3 states in terms of highest percentage of top-up loans. Southern states like Tamil Nadu and Karnataka are geographies with lower percentage of top-up loans disbursed.
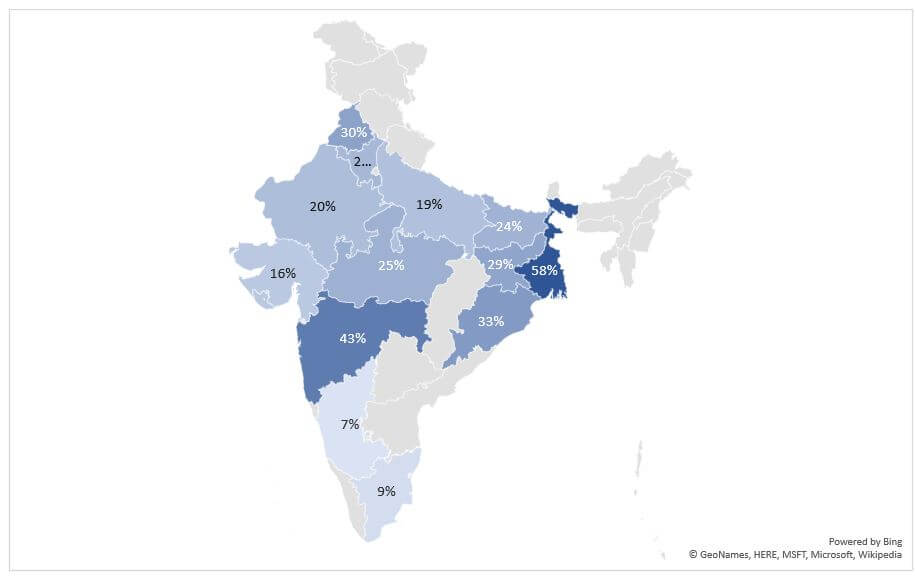
Exhibit 6: State wise distribution of percentage of top-up loans
Conclusion
Microfinance institutions have disbursed top-up loans to underlying borrowersto help them wade through difficult times posed by covid-19 pandemic. This immediate support lent by financial institutions should help borrowers revive their economic activities, wherever there is a genuine need of it. While this is an essential support required from borrowers’ standpoint, it would also be important for all lenders to closely monitor performance of these loans.
In this blog, we defined a methodology on how to identify top-up loans and analysedwhich borrower and market segments that have availed top-up loans in microfinance. Percentage of borrowers availing top-up loans is increasing with increase in both indebtedness levels and EMI levels. This corroborates with shrinking income levels in current pandemic and need for additional financing is more at higher indebtedness levels. Higher percentage of borrowers in markets like West Bengal, Maharashtra and Odishahave availed top-up loans,as economic activities in these geographies had seen more severe impact due to stricter lockdowns in the first wave of the Covid 19 pandemic.
It is too early to comment on performance of top-up loans as most of them have been serviced only for a short duration of 1-3 months when scrub repository was pulled.

