Robust risk management based on domain expertise, proprietary risk models and data repository driving asset quality
We consider risk monitoring as a central aspect of our operations, extending across all sectors, channels, and borrower segments. Risk management forms the core of our business, and over time, we have developed and deployed a tailored risk management system. We have customized our risk management systems for each of the focused sectors and channels in which we operate and these systems which are specific to each offering, enable us to develop a diversified portfolio and address risks.
Overall risk management is governed by an enterprise risk management framework which covers nine types of principal risks faced by us. Our ERM Framework enables us to identify, monitor and manage various types of risks inherent in our business operations. We have a monthly process of reviewing exposures through exposure reports and a process of reviewing and approving counterparty limits across products based on the most recent quarterly information as well as our risk monitoring feedback including insights from our field visits. Our qualitative and quantitative risk insights also feed into the portfolio selection for securitization and direct assignment transactions. Managing the risks under the ERM Framework allows us to view our existing risks holistically, while improving our ability to identify and proactively manage new types of risks.
We leverage our own expertise and data to develop customized and proprietary risk models that suit our offerings, products and markets, and enhance our capital efficiency. Most of our credit risk management processes are enhanced through deep analytical models built on Nimbus, which leverages internal and external data sources to create in-depth risk analytics and modelling, and has early warning systems that help us to be proactive in dealing with and minimising risks.
With additional data points and sources being added every year to Nimbus, the risk models continue to become more robust. As of March 31, 2024, our quantitative analysis is based on over 35.17 million data points which includes: (a) loan pools we have evaluated and invested in for our Originator Partners from our Investor Partners through securitisations and direct assignments, and (b) over [18.58 million] Direct to Customers Lending loans disbursed by us, Moreover, secondary data from external data sources such as credit bureaus and economic research portals is used for analysing pin code level borrower characteristics such as indebtedness, collection efficiencies and sector growth trends.
In addition to our large data repository, we also add insights from our on-field surveillance to Nimbus to allow for a comprehensive data. We also obtain and periodically update the credit information of our customers by scrubbing the credit bureaus, which is used in pool selection and building our financials models. A combination of insights from the data, scrub analysis and on-field surveillance/ monitoring team enables us to carry out benchmarking of all our Originator Partners and Retail Lending Partners, which is a key input in our credit decision-making process, portfolio stress testing, early warning indications.
As of March 31, 2024, we conducted reviews on a total of 677 Originator Partners, out of which, we performed due diligence on 430 Originator Partners and successfully onboarded 328 Originator Partners onto our platform. We also use these insights to provide feedback to Originator Partners including comparison with operational and financial industry benchmarks. Further, these insights are also used to conduct webinars for domestic and offshore investors and publish detailed sector presentations.
We have developed over 30 analytical models, as of March 31, 2024, using the data repository and insights from our on-field surveillance and continuously strengthen them by adding more data points and sources. We have also launched Nu Score, a proprietary machine learning based solution for our Originator Partners’ underwriting requirements, which offers real-time data-backed risk assessment for evaluating a borrower.
Our diversified presence across India mitigates the impact of any adverse geography specific risk events including natural disasters. Further, our sectoral diversification has helped us in mitigating the effects of slowing demand for credit in standalone sectors owing to cyclicality, events or regulatory changes affecting such sectors, and in maintaining the health of our portfolio thereby, resulting in lower volatility of risk, return and growth. Diversification of our portfolio is also governed through exposure ceilings and closely tracked by our risk management committee. Such diversification provides a risk buffer and drive risk-adjusted returns, as it can reduce the volatility and vulnerability of the portfolio or business performance to a specific market, product or industry, sector, while also increasing the opportunities and flexibility for growth and innovation in other markets, products and industries. In addition, we have developed a comprehensive collection capacity, which includes an in-house call centre, own team and empanelled agencies for field collections and field collections teams, enabling us to maximize post-default recoveries of our exposures, in addition to pre-default early alerts to control risk.
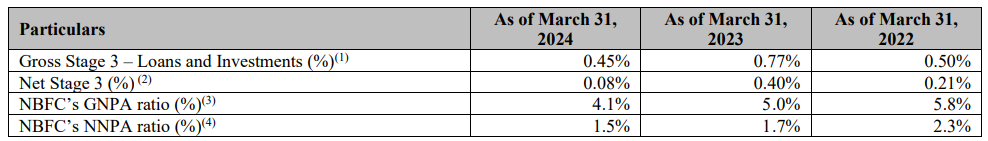
Our risk management approach has enabled us to actively identify, monitor and manage risks towards creating strong and sustainable business operations. As a result of our approach to risk management, according to the CRISIL Report, we had one of the lowest GNPA of 0.45% and NNPA of 0.08%, as of Fiscal 2024. Set out below are certain details of our asset quality along with the GNPA and NNPA ratio of NBFCs in India as indicated in the CRISIL Report as of the dates indicated:
Collections and delinquency management: As part of our portfolio monitoring activities, we combine data analytics with field intelligence. This provides us with early warning signals on the health of assets in our portfolio. For instance, insights from our data analytics and field intelligence on socio-political stress building in Assam in Fiscal 2020 and West Bengal in Fiscal 2020-2021 helped us in scaling down our exposure to those regions. We take necessary actions after considering the nature and severity of risks to our assets.
We have an experienced collections team which manages loan recovery and delinquencies in our portfolio. Our collections team supports both Direct to Customer Lending and Intermediate Retail Lending. Based on the assessment of stress in a specific asset, we also take appropriate legal actions against a borrower/issuer which may include filing of criminal complaints, initiating proceedings under the IBC or civil suits for recovery.