The microfinance industry has been operating at stable PAR levels post demonetization while growing at a consistent rate. While this reflects the resilience of the institutions and demand from their borrowers, a few questions emerge on the state-of-the-sector that need to be addressed in a robust manner using data and ground level observations.
In this blog, we look at the trends around these three key factors – ticket size, indebtedness and EMI, and delve into data to explore if any of these factors are a cause for concern.
Background
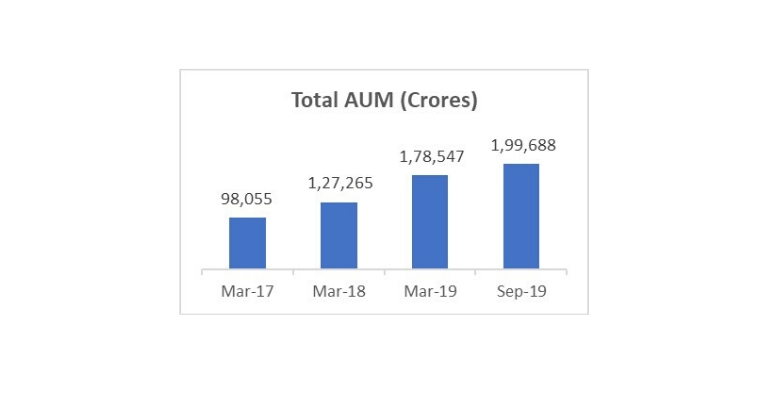
As per industry level pin-code reports subscribed from Equifax, the microfinance industry has exhibited a steady growth rate in terms of AUM, with an average growth rate of 7.8% quarter on quarter and annual growth rate of 36% in last one year from Sep-18 to Sep-19. As seen in Exhibit 1, MFI industry’s AUM stood at INR 0.98 Lakh crores as on Mar-17, immediately after demonetization, and increased to INR 1.99 Lakh crores as on Sep-19 numbers, a 33% CAGR in 2.5 years.
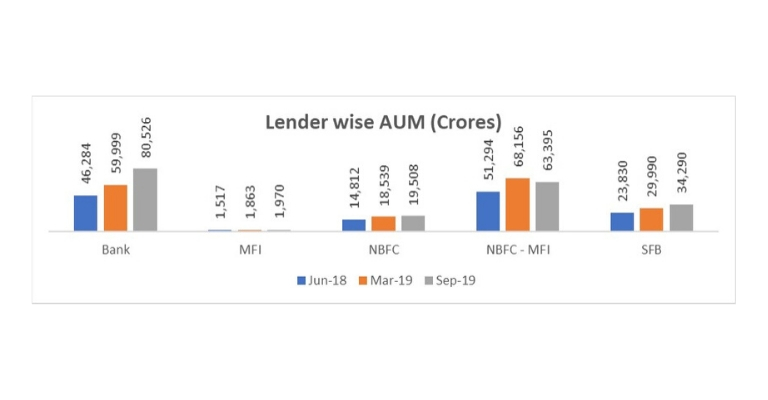
Exhibit 2 shows lender wise split of industry level AUM as on Jun-18, Mar-19 and Sep-19. While the category NBFC-MFI constitutes microfinance institutions (MFIs) registered with Reserve bank of India (RBI), MFI category constitutes NGO-MFIs and other micro finance institutions not registered with RBI. As on Jun-18 and Mar-19, NBFC-MFIs have the highest market share followed by banks and small finance banks (SFBs). NBFC-MFI AUM has reduced in Sep-19 due to acquisition of one of the major NBFC MFIs by a Bank.
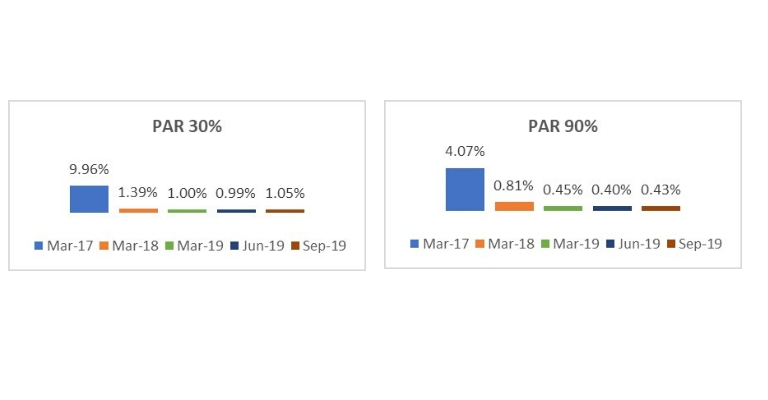
Industry wide asset quality numbers show a steady PAR 30% and PAR 90% levels since Mar-18. PAR 30% and PAR 90% numbers are comparatively higher in Mar-17 due to demonetization. Asset quality levels have been stable for post demonetization origination. PAR 30% and PAR 90% numbers calculated here exclude 180+ Days Past Due (DPD) portfolio.
Data used for the analysis
We have used following datasets for this analysis
Repayment frequencies of different underlying obligations of each customer can vary from bi-weekly to monthly. For EMI based analysis, using scrub data of all underlying customers, all live obligations of customers are converted into monthly frequency.
Assumptions
180+ DPD portfolio is not considered in order to exclude demonetization impact from this analysis. A microfinance client can borrow from different types of financial institutions like Banks, NBFC-MFIs, SFBs. For all client level analyses specific to a lender, below are the definitions used.
In all the lender wise analyses presented across different key factors, three biggest lender types (Banks, NBFC-MFIs and SFBs) are only considered as they cumulatively constitute ~90% of portfolio.
Data analysis and findings
Ticket size
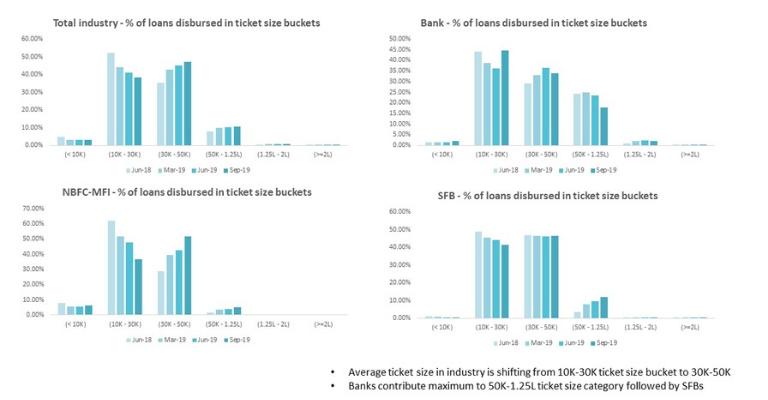
Exhibit 4 shows ticket size trends of overall MFI industry from Jun-18 to Sep-19. It can be clearly inferred that average ticket size of industry has moved from INR 10K-30K category to INR 30K-50K category. Also exhibit 4 indicates that banks are more prevalent in higher ticket size categories of INR >50K.
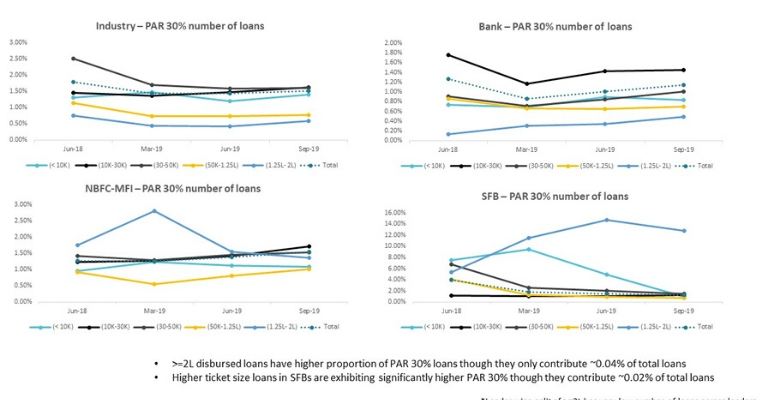
Exhibit 5 contains lender wise PAR 30 loans as percentage of total number of loans in each ticket size bucket. It can be inferred that for ticket sizes until INR 1.25 Lakhs, there is no specific category which is performing very differently. High ticket size loans of SFBs (INR 1.25L-2L) are an exception and have significantly high PAR 30 percentage of loans, but they constitute only 0.01% of total loans disbursed by SFBs.
Indebtedness
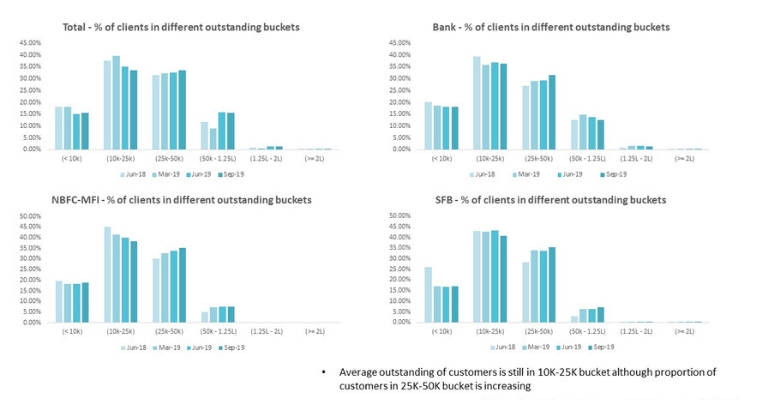
From exhibit 6, it can be inferred that average outstanding of customers is in INR 10K-25K category although it is gradually shifting to INR 25K-50K. While 1.5% of customers of banks are in INR >1.25L outstanding bucket category, only 0.1%-0.2% customers of NBFC-MFIs and SFBs are in INR >1.25L category.
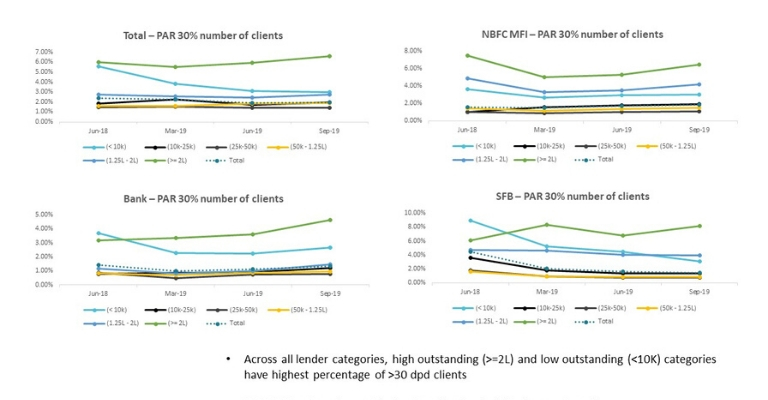
Asset quality of different indebtedness categories is seen in exhibit 7, where lender wise PAR 30 clients as percentage of total number of clients is plotted. Across all lender types, high indebtedness (INR 1.25L-2L and INR >2L) and low indebtedness (INR <10K) categories have highest percentage of PAR 30 clients. Although number of clients in high indebtedness categories is low, ranging from 1.5% in banks to 0.1%-0.2% in NBFC-MFIs and SFBs, asset quality of these categories is worse compared to other indebtedness categories across all types of lenders. (except INR 1.25L-2L category in banks)
EMI
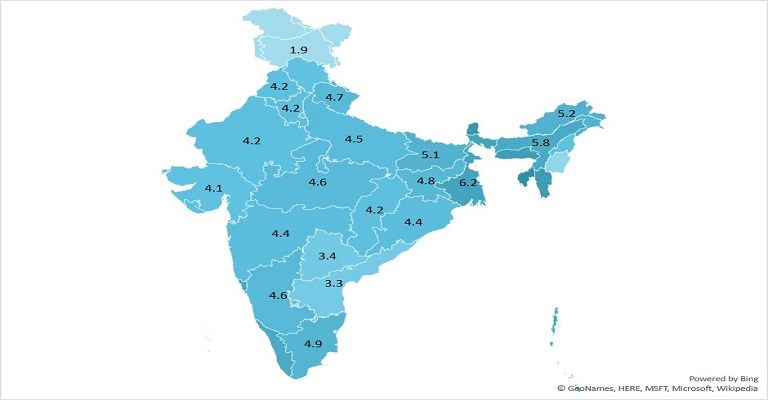
For this analysis, repository of scrub outputs from pools of loans securitized by Northern Arc is considered, where client level EMIs are calculated by transforming all obligations to monthly levels. The unit of analysis here is monthly obligations and not strictly EMI but we are using the term EMI for ease of understanding. State wise average EMI levels are depicted in exhibit 8 with eastern region showing higher average EMI levels.
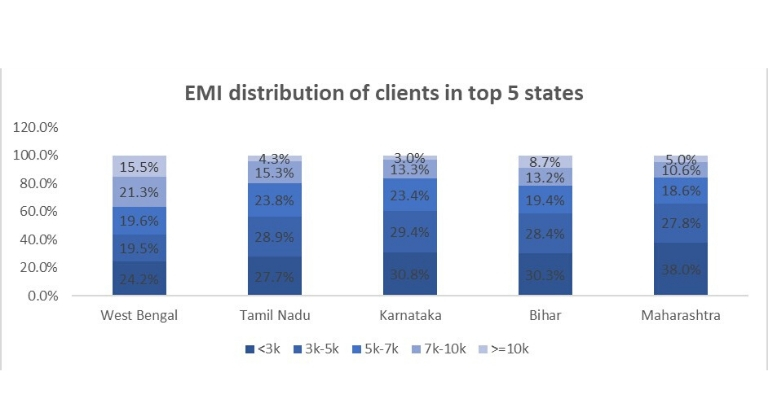
Exhibit 9 shows EMI distribution of clients in top 5 states (in AUM terms as on Jun-19). West Bengal has the highest proportion of clients (36.8%) in top EMI bucket (>7K), while rest of the states have ~15-20% of clients in these categories.
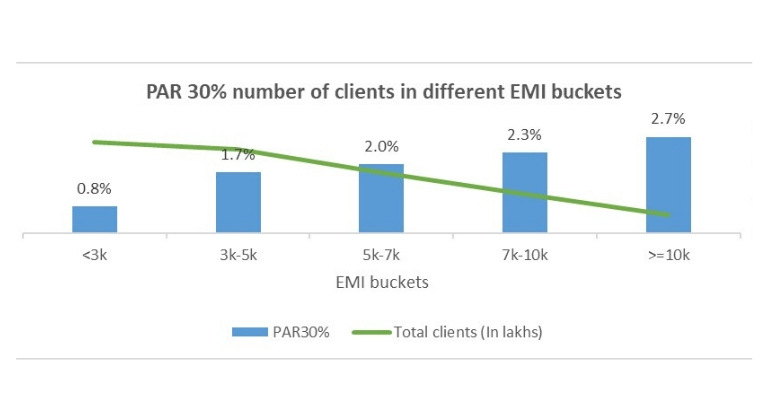
From exhibit 10, it can be inferred that as EMI levels are increasing, percentage of PAR 30 clients is also increasing. Also, it can be observed that there are considerable number of clients in higher EMI categories (7.5 Lakh clients).
Conclusion
Given the consistent growth rates seen in microfinance industry, especially post demonetization era, we have analysed trends being observed in three key factors – ticket size, indebtedness and EMI.
Industry level average ticket size has shifted from INR 10-30K bucket to INR 30-50K bucket and only banks are predominantly prevalent in INR >50k ticket size category. All categories of ticket sizes are performing similarly and there are no outliers in terms of asset quality (except INR 1.25L-2L category in SFBs).
Indebtedness and EMI at a client level are better indicators of risk as we were able to identify higher risk categories in these factors. The higher indebtedness categories (INR 1.25L-2L and INR >2L) and lowest indebtedness category (INR <10K) are performing poorly compared to other categories. INR <10K indebtedness category is a surprise inclusion here and further analysis is required to understand exact nature of these clients. As EMI increases, risk associated with that category is also increasing, which is measured by percentage of PAR 30 clients. Similar trends are observed in percentage of PAR 90 clients as well. Our field observations, through end customer visits, have reinforced these data-based findings.
While data suggests that indebtedness and EMI are better indicators of risk, thresholds for these indicators need to be studied. This analysis can be extended to set thresholds geography wise as limits for serviceable levels of debt will depend on economic activities prevalent in different geographies. In addition to geography wise limits, this study can be further enriched by adding client profile through client specific parameters like income, occupation, vintage of client among other factors.